
Let's focus on this graph:
Two main points I'd like to make:
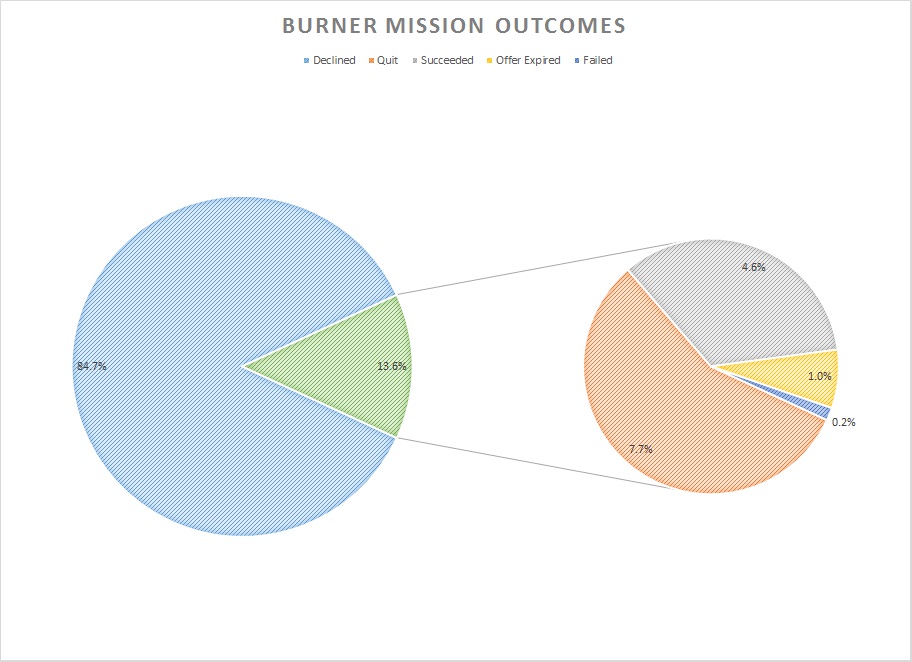
1. Only 15 out of 100 Burner missions are actually accepted. The rest are declined. Fewer succeed.
I was initially shocked that the accept rate was so low. I figured there would be a lot of declines, but I hadn't really thought about what I considered 'a lot' to mean. I guess 85% to me is a metric buttload, which is approximately double 'a lot.'
This spawns a concern: Are too few people partaking in the new content to warrant CCP to continue to deploy burner updates? What is their threshold of pain for investing dev $$ into content that relatively few players are apparently participating in?
CCP says they are happy with the response so far. I guess I'll take that at face value. The data they didn't share is how many unique players attempted a Burner mission and how many players then repeated the content the next time it was offered.
It would be interesting to know if the number of players accepting burners is growing or shrinking.
For now, they're extending the system; by this time next week we'll have the mk2 content. But I worry about maintaining a commitment that sees cruiser (and hopefully battleship) sized burners.
2. Let's do some math.
Start with this quote:
Over 6000 burner missions have been completed to date...
I've often wondered how many lvl4 missions get run in a given week across the entire game. If that data has ever been released, I've missed it. But I think with the data in Fozzie's blog, we can make a couple of estimates.
DISCLAIMER: I'm going to be doing some fuzzy math and making some astoundingly bad assumptions. The intent here is just to get a bound on the problem, so see what neighborhood the numbers might live in.
With the information we have, the first step is pretty straightforward. If about 6,000 burner missions were successful, and that equals 4.6% of the burners offered (as shown in the the graph), it means that 130,435 burners were offered in the 3 week period this data was collected (aka 43,478 burners per week).
Ok, so what's the ratio of Burners to the entire lvl4 missions completed? I have no idea. Personally, it's been running about 10:1, but I have a VERY limited data set. I've seen forum reports saying they're getting closer to 3:1 or 5:1, but they too have a limited data set.
Let's use 10:1, just to try to bound the upper limit of the number. That yields 434,782 lvl4 missions completed per week within the cluster. That seems like a lot, but again, I'm trying to get the upper limit to the number. And there are a LOT of mission hubs.
If we make more assumptions, we get more numbers, so let's keep going.
Assuming an average bounty payout of 12M isk, there's 5.2 trillion isk flowing into the game every week. Not counting salvage or loot.
If you assume an average LP payout (which varies wildly by mission and by security status) of 7500 LP per mission, it means that there is 3.26 billion LP being handed out each week.
Those are some big numbers. I'm probably way off, but it's interesting to think about.
What's Playing: TOOL, Pushit
No comments:
Post a Comment